
12 e-commerce KPIs you should track (and how to calculate them)
· 9 min read
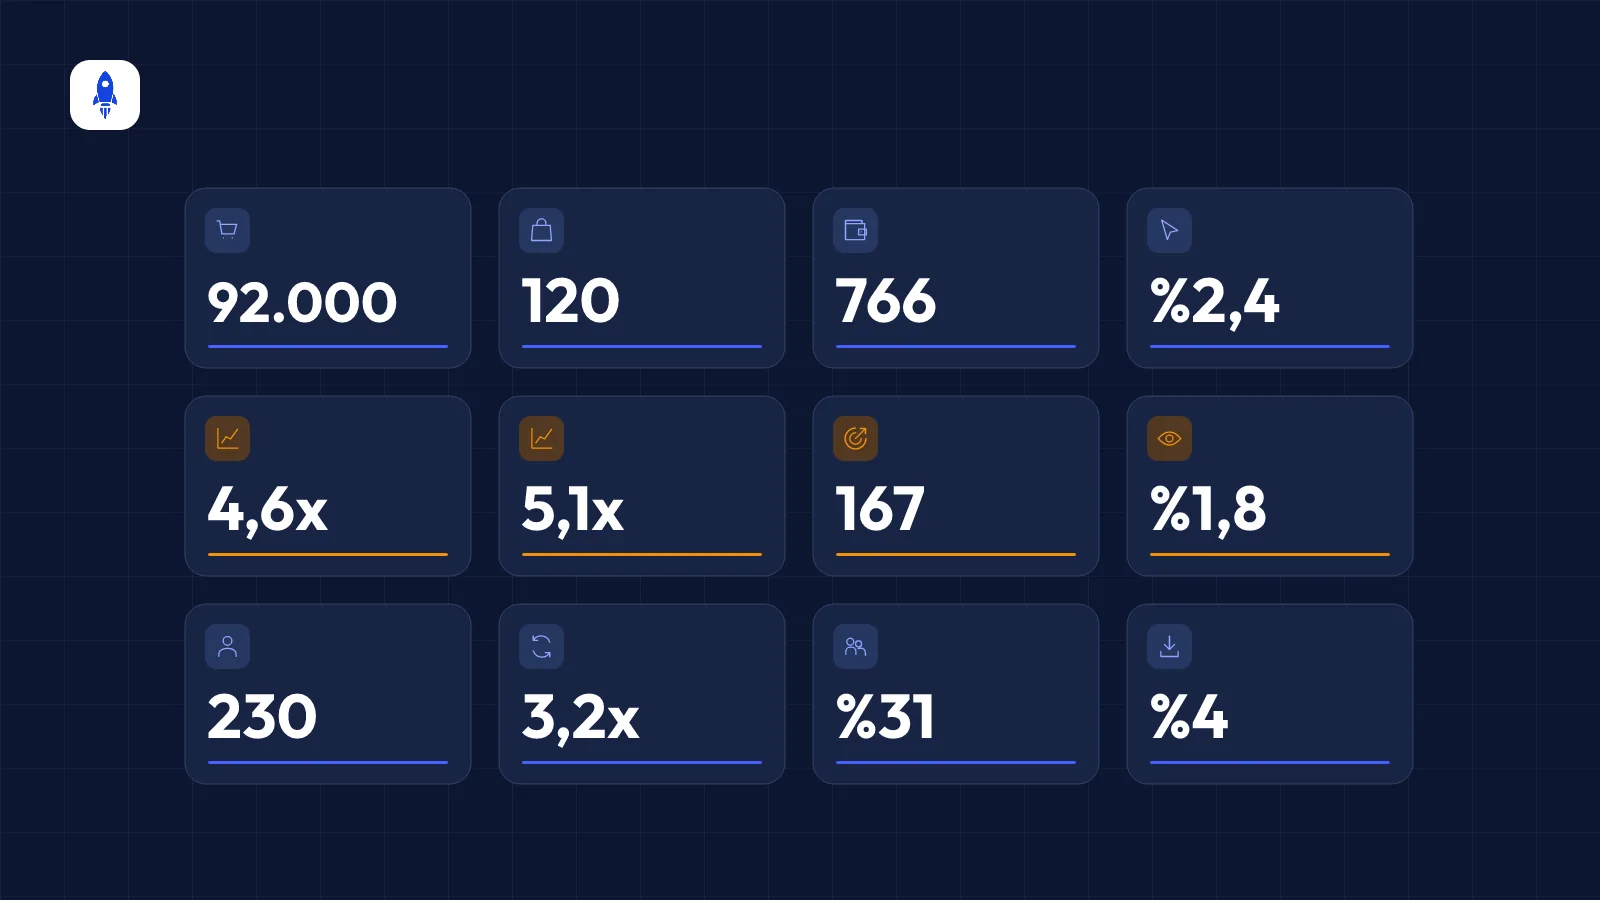
You can track dozens of metrics in e-commerce, but few drive decisions: revenue, orders, average order value, conversion rate, ROAS, customer acquisition cost and repeat purchase rate are the foundation. Tracking them weekly against the previous period reveals most problems early.
What is the difference between a KPI and a metric?
Every measurable value is a metric: page views, clicks, follower count… A KPI (key performance indicator) is a metric tied directly to your business goal that drives decisions. If you know what to do when the number goes up or down, it's a KPI.
Sales KPIs
1. Revenue
Total sales in a given period. Track the website, marketplaces and offline sales separately and in total. Use net revenue, after cancellations and returns.
2. Number of orders
Is revenue growth coming from more orders or bigger baskets? You need to track order count separately to tell.
3. Average order value (AOV)
Free-shipping thresholds, bundles and complementary product suggestions raise AOV. Because it brings more revenue for the same ad cost, it also improves ROAS directly.
4. Conversion rate
Shows what percentage of visitors buy. Sudden drops often point to a technical issue (checkout, page speed, stock).
Advertising KPIs
5. ROAS
Shows advertising efficiency. We explain how to work out break-even ROAS in our ROAS guide.
6. Blended ROAS / MER
Revenue from all sales channels divided by total ad (or marketing) spend. It isn't affected by attribution overlap between platforms, so it's more reliable for budget decisions (our marketplace article).
7. Cost per acquisition (CPA)
The ad cost of getting one sale. Read it together with your AOV and margin.
8. Click-through rate (CTR) and cost per thousand impressions (CPM)
Show whether an ad attracts interest and what it costs to reach the audience. If CTR falls while frequency rises, consider creative fatigue.
Customer KPIs
9. Customer acquisition cost (CAC)
The cost of winning a new customer. Unlike CPA, it only counts first-time buyers and covers all marketing costs.
10. Customer lifetime value (LTV)
The total revenue (or profit) a customer brings over their relationship with your brand. A simple approximation: average order value × yearly order frequency × average customer lifespan (years).
11. Repeat purchase rate
The share of customers who place more than one order in a period. As repeat purchases grow, dependence on ads falls and profitability rises.
12. Return and cancellation rate
Shows how much of reported revenue actually stays. A high return rate lowers both profit and the reliability of ad ROAS.
How often should KPIs be tracked?
- Daily: Revenue, orders, ad spend — anomaly checks.
- Weekly: ROAS, CPA, conversion rate, AOV — campaign decisions.
- Monthly: CAC, LTV, repeat purchases, return rate — strategy and budget.
Track every KPI against the previous period; a single number on its own rarely says much. When comparing periods, matching calendar days (for example “1–9 October” vs “1–9 September”) reduces misleading results.
Bringing KPIs onto one screen
These metrics come from different places: revenue and orders from your store and marketplaces, spend and clicks from ad platforms. Pulling them together by hand every week takes time and invites errors. CiroFly combines sales and ad channels in one dashboard and shows these KPIs compared with the previous period.
Frequently asked questions
What is the most important e-commerce KPI?+
There isn't just one; revenue, AOV, conversion rate and ROAS together show the health of the business. In the long run, the LTV ÷ CAC ratio best shows whether growth is sustainable.
How do you calculate average order value?+
AOV = revenue ÷ number of orders. For example, 450,000 in revenue and 1,000 orders gives an AOV of 450.
What is the difference between CAC and CPA?+
CPA is ad spend divided by conversions and also counts returning customers. CAC is total marketing spend divided by new customers only.
What is a good e-commerce conversion rate?+
It varies a lot by industry, price point and traffic source. Using your own historical average as the benchmark and tracking change over time is more meaningful than comparing with general averages.
See your ad, store and marketplace data in one dashboard
CiroFly combines your sales and ad channels and updates ROAS, revenue and channel breakdowns automatically every day.
Related articles

How to calculate ROAS in e-commerce — and what is a good ROAS?
The ROAS formula, how to work out break-even ROAS, how VAT and returns affect it, and how to set a target ROAS for your brand step by step.
How to count marketplace sales in your ad performance
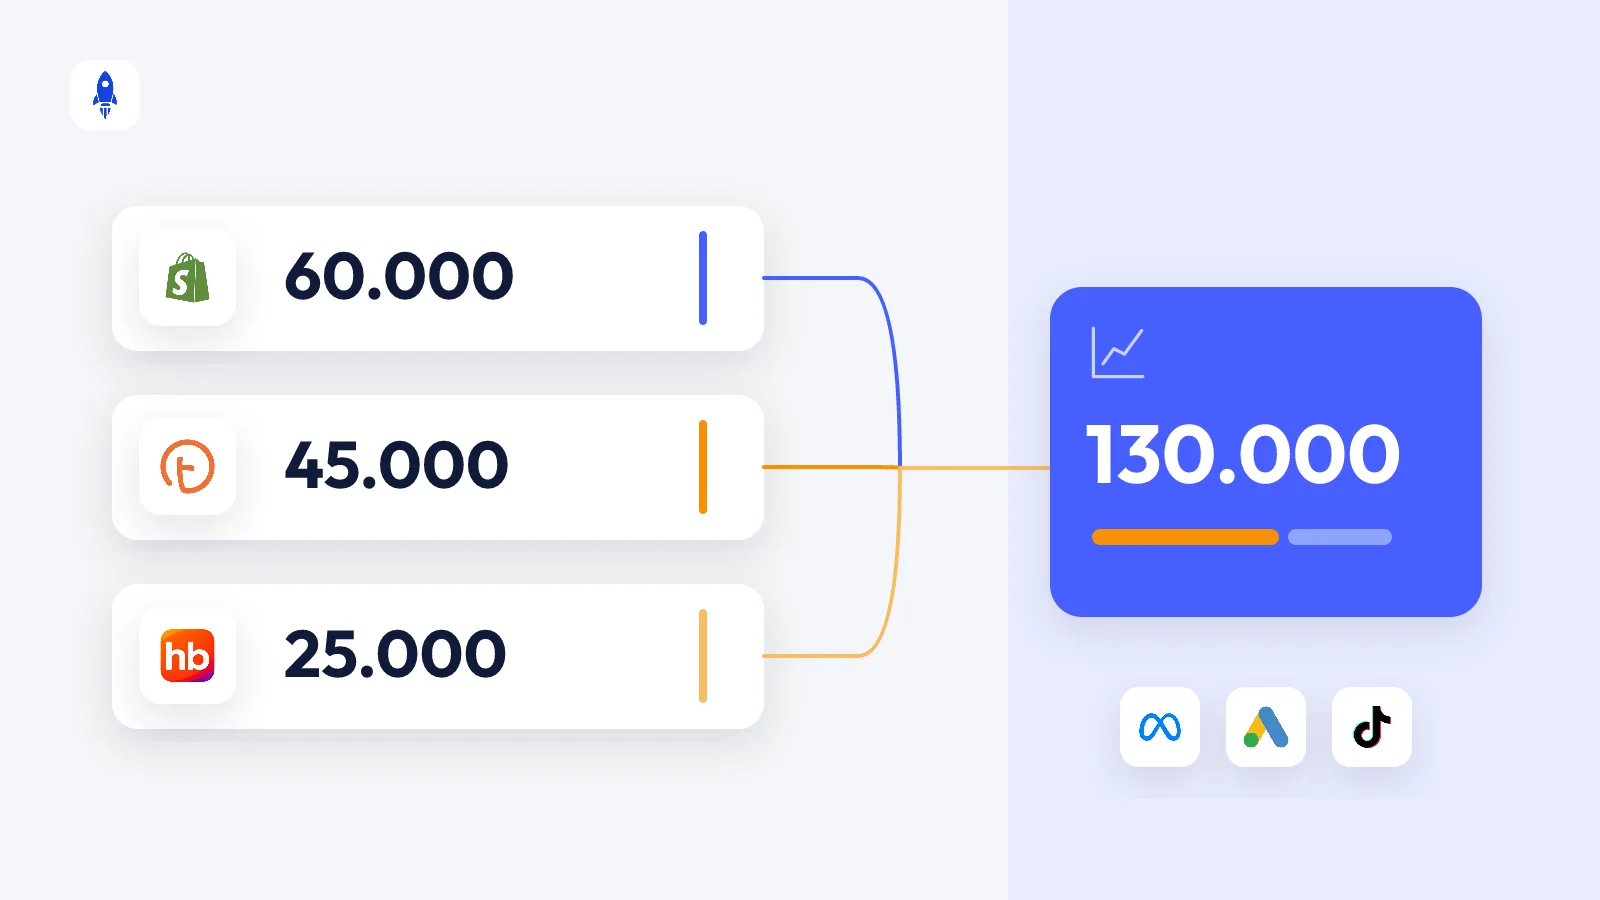
Measuring how Meta and Google ads affect sales on marketplaces like Trendyol, Hepsiburada and n11 — reading it correctly with blended ROAS, MER and channel share.
What is the Meta Conversions API (CAPI) and why does e-commerce need it?
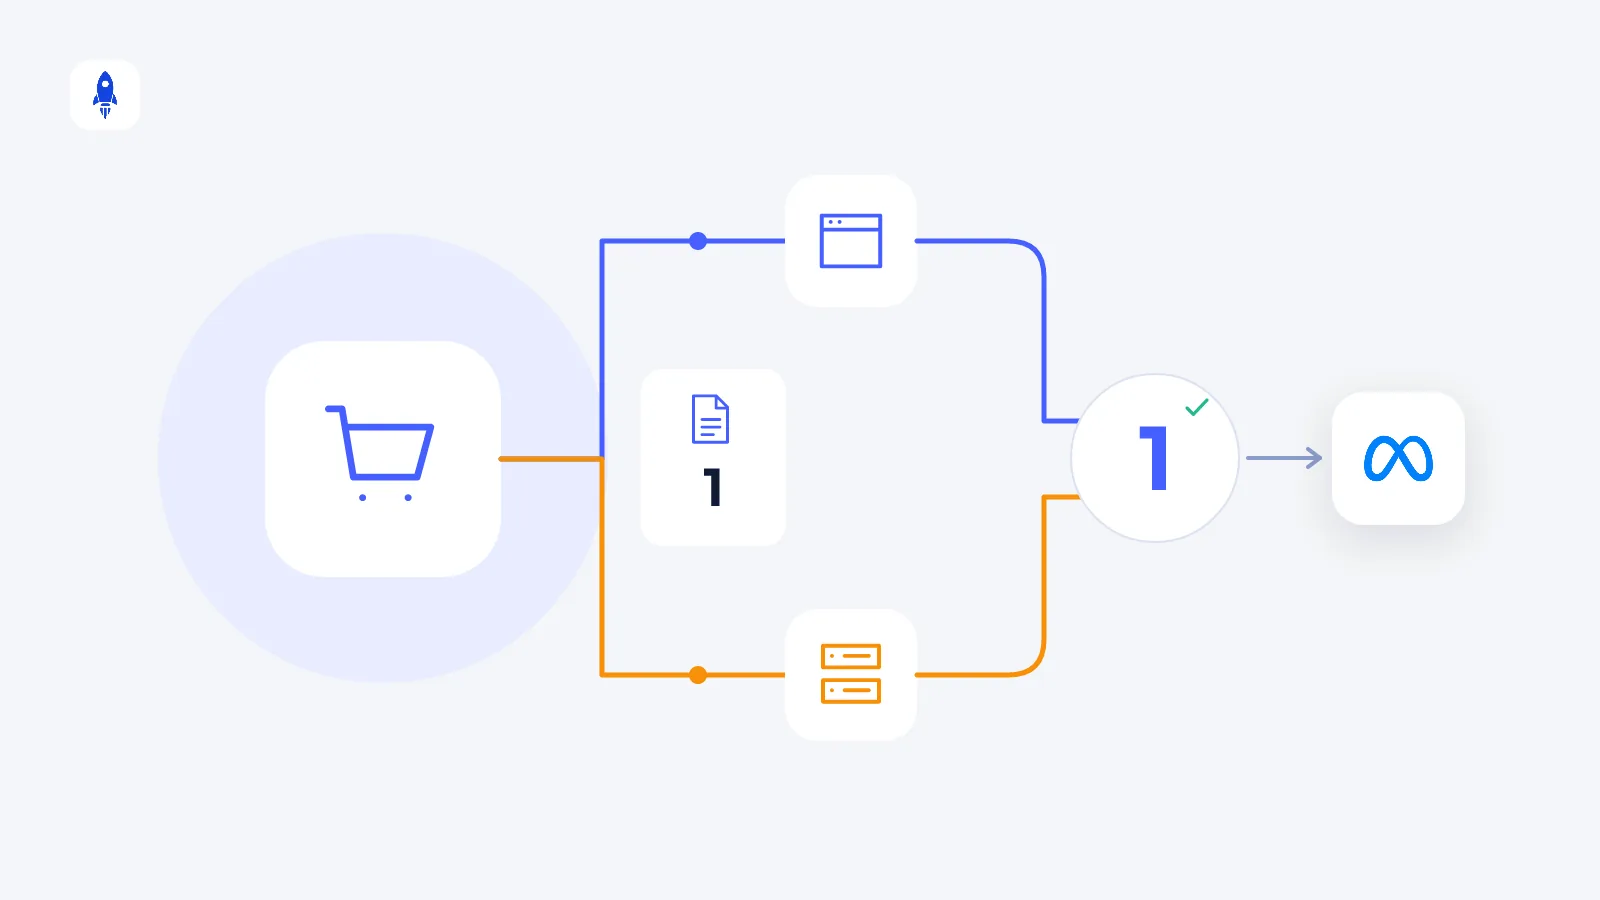
How the Conversions API captures sales the Meta Pixel misses, how double counting is prevented, Event Match Quality, and what to check when setting it up.