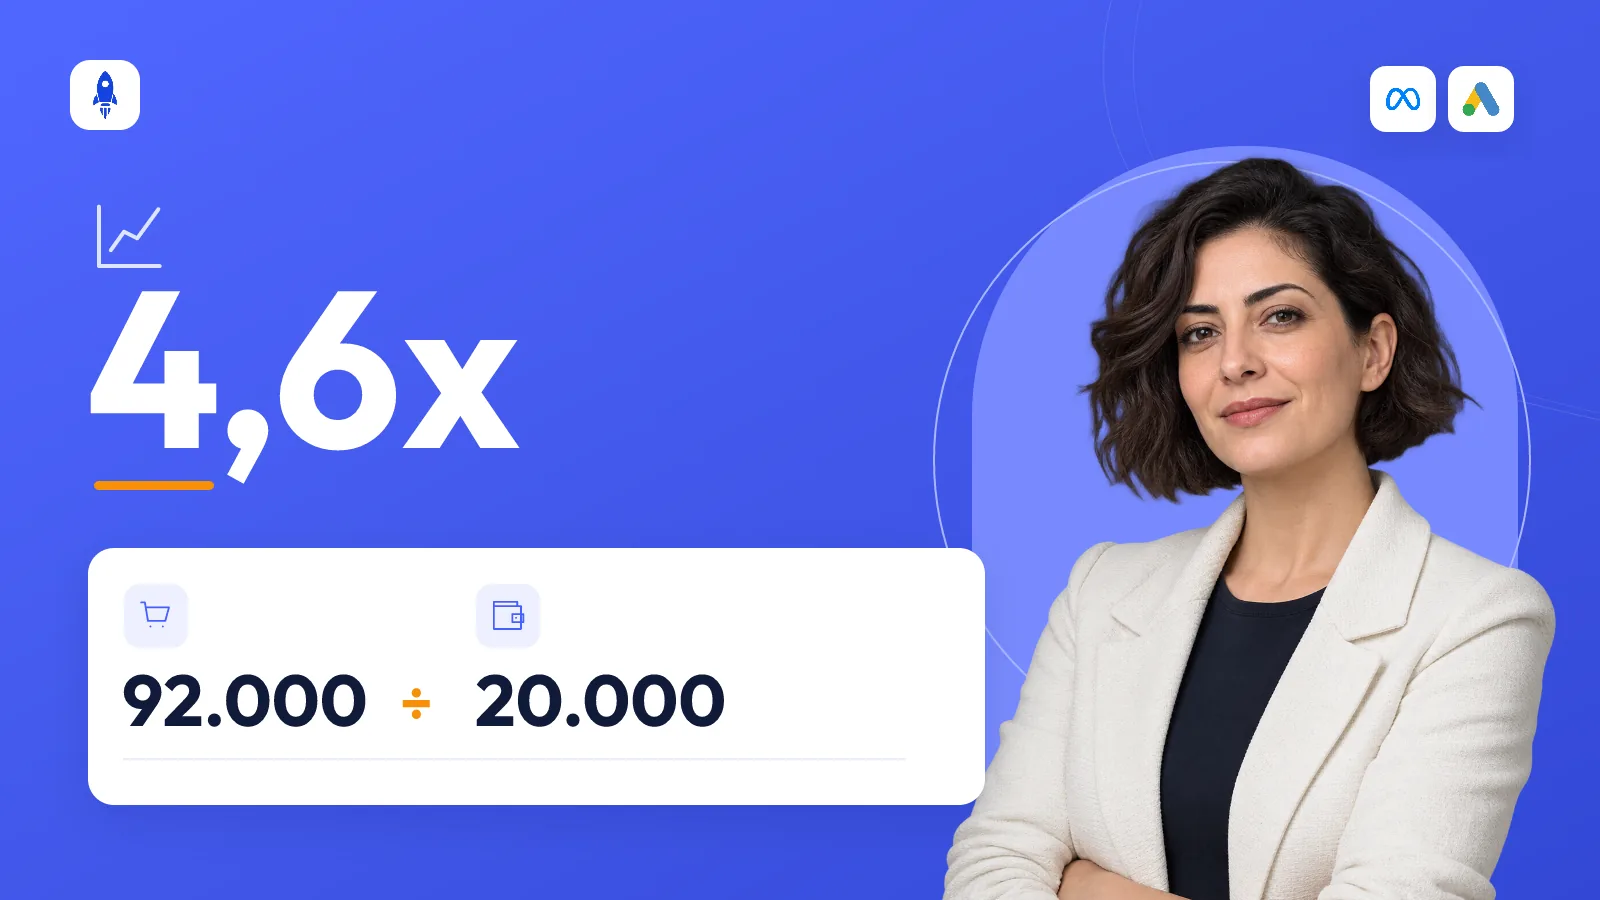
How to calculate ROAS in e-commerce — and what is a good ROAS?
The ROAS formula, how to work out break-even ROAS, how VAT and returns affect it, and how to set a target ROAS for your brand step by step.
Blog
ROAS, budgets, measurement, marketplaces and agency reporting — clear answers to the most common performance-marketing questions.
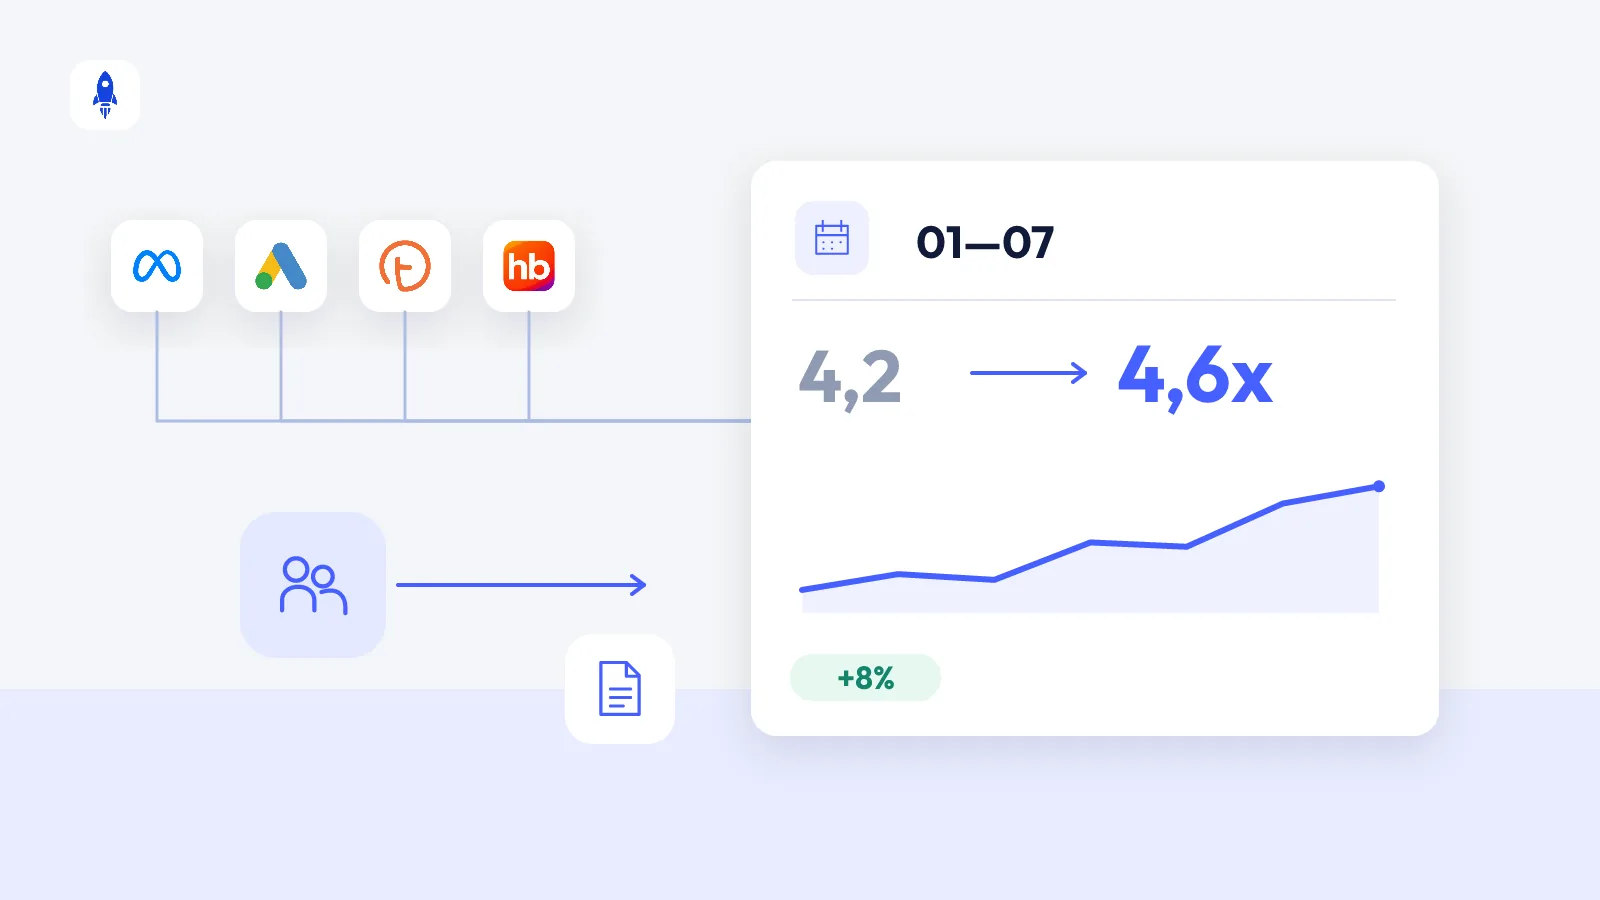
The ROAS formula, how to work out break-even ROAS, how VAT and returns affect it, and how to set a target ROAS for your brand step by step.
Seven reasons ad platform sales differ from your store revenue, how much difference is normal, and which number to base decisions on.
Measuring how Meta and Google ads affect sales on marketplaces like Trendyol, Hepsiburada and n11 — reading it correctly with blended ROAS, MER and channel share.
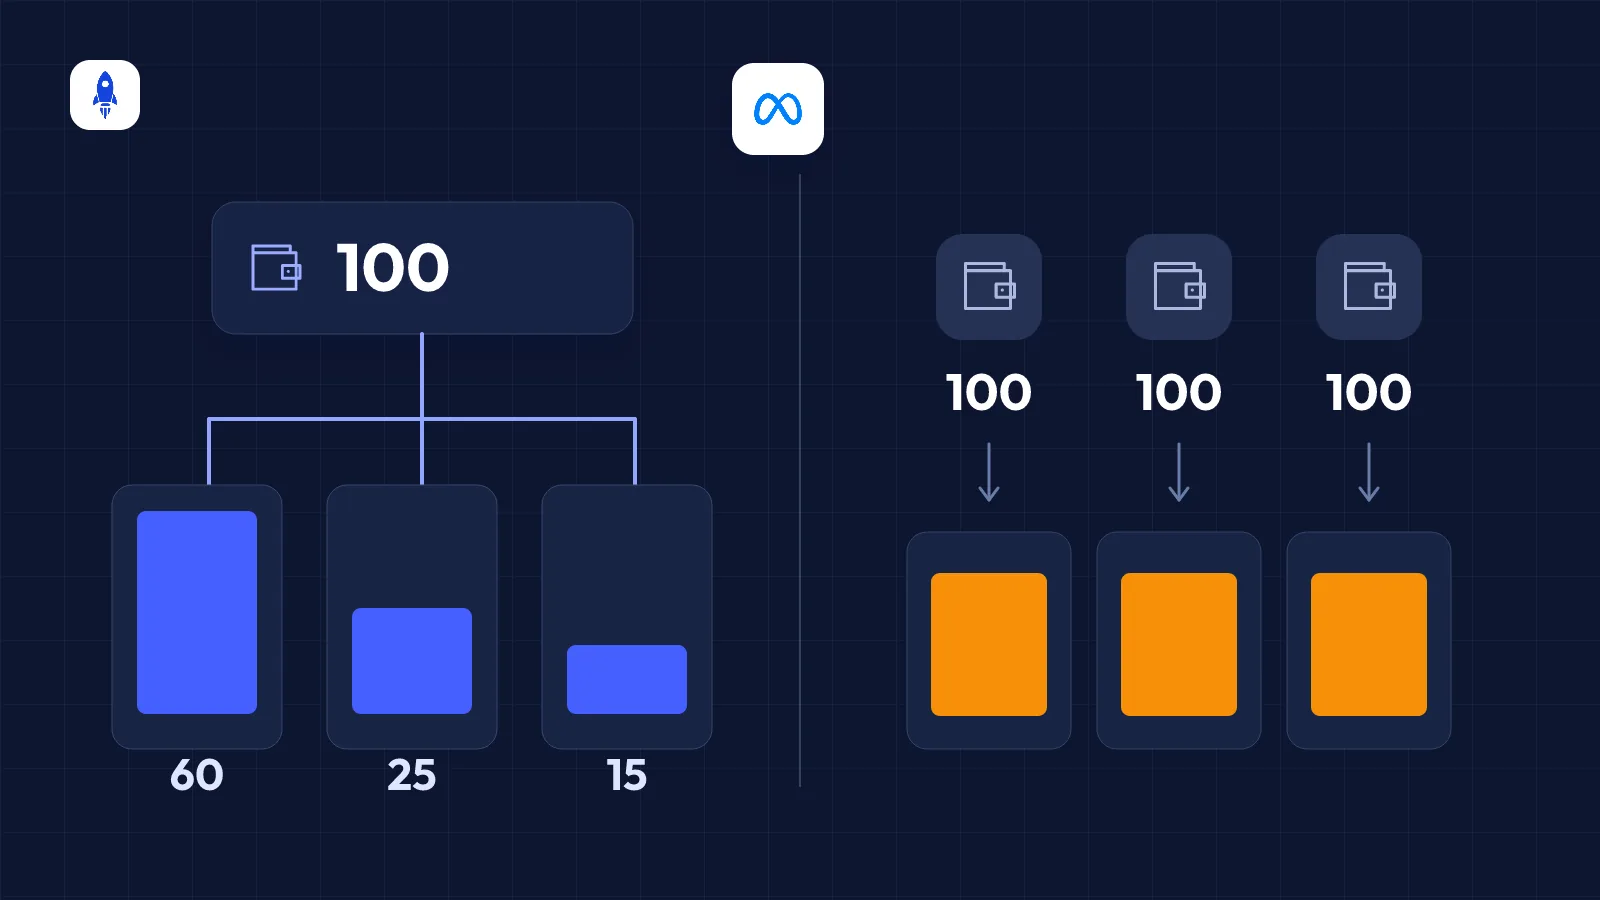
A practical method to work out your ad budget backwards from a revenue target, split it between Meta and Google, and know when to scale up or cut back.
A November ad calendar for e-commerce brands: preparation, warm-up, campaign week and after — with budget, creative, stock and marketplace planning.
The difference between campaign budget (Advantage+ campaign budget, CBO) and ad set budget (ABO) in Meta, when each works better, and the right structure for testing.
The signals that show an ad has lost its impact (frequency, CTR, CPM, ROAS), how to spot fatigue early, and a routine for refreshing creatives.
The sections of a weekly client report for ad agencies, which KPIs to show, how to write the commentary, and how to cut the time it takes to prepare.
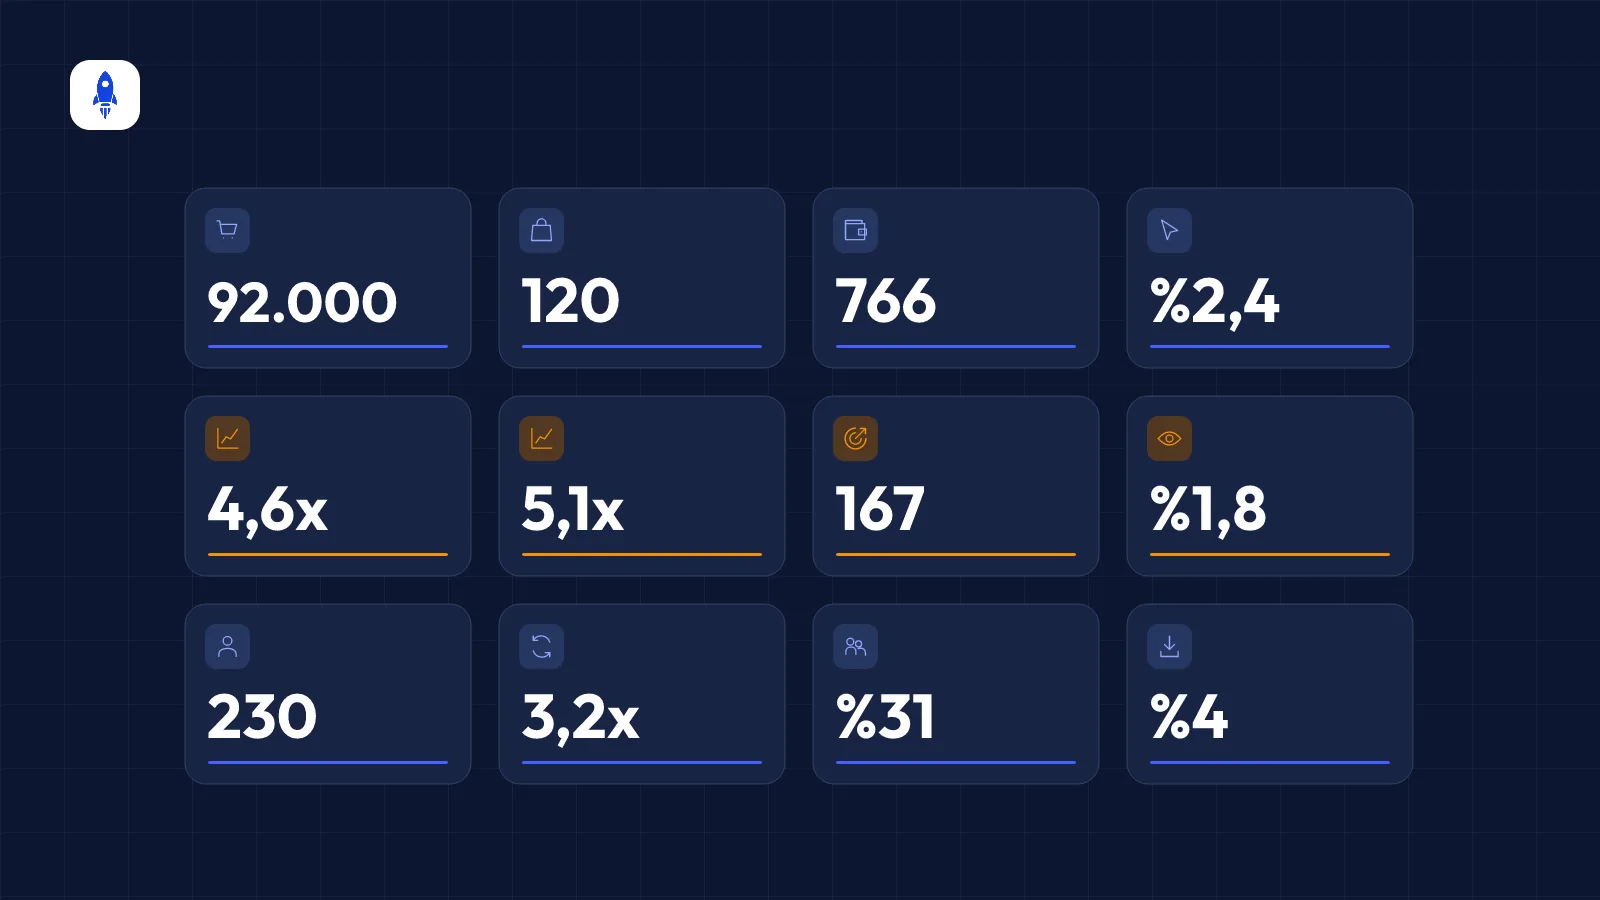
Formulas for revenue, orders, average order value, conversion rate, ROAS, customer acquisition cost, lifetime value and other e-commerce KPIs — and how to read them.
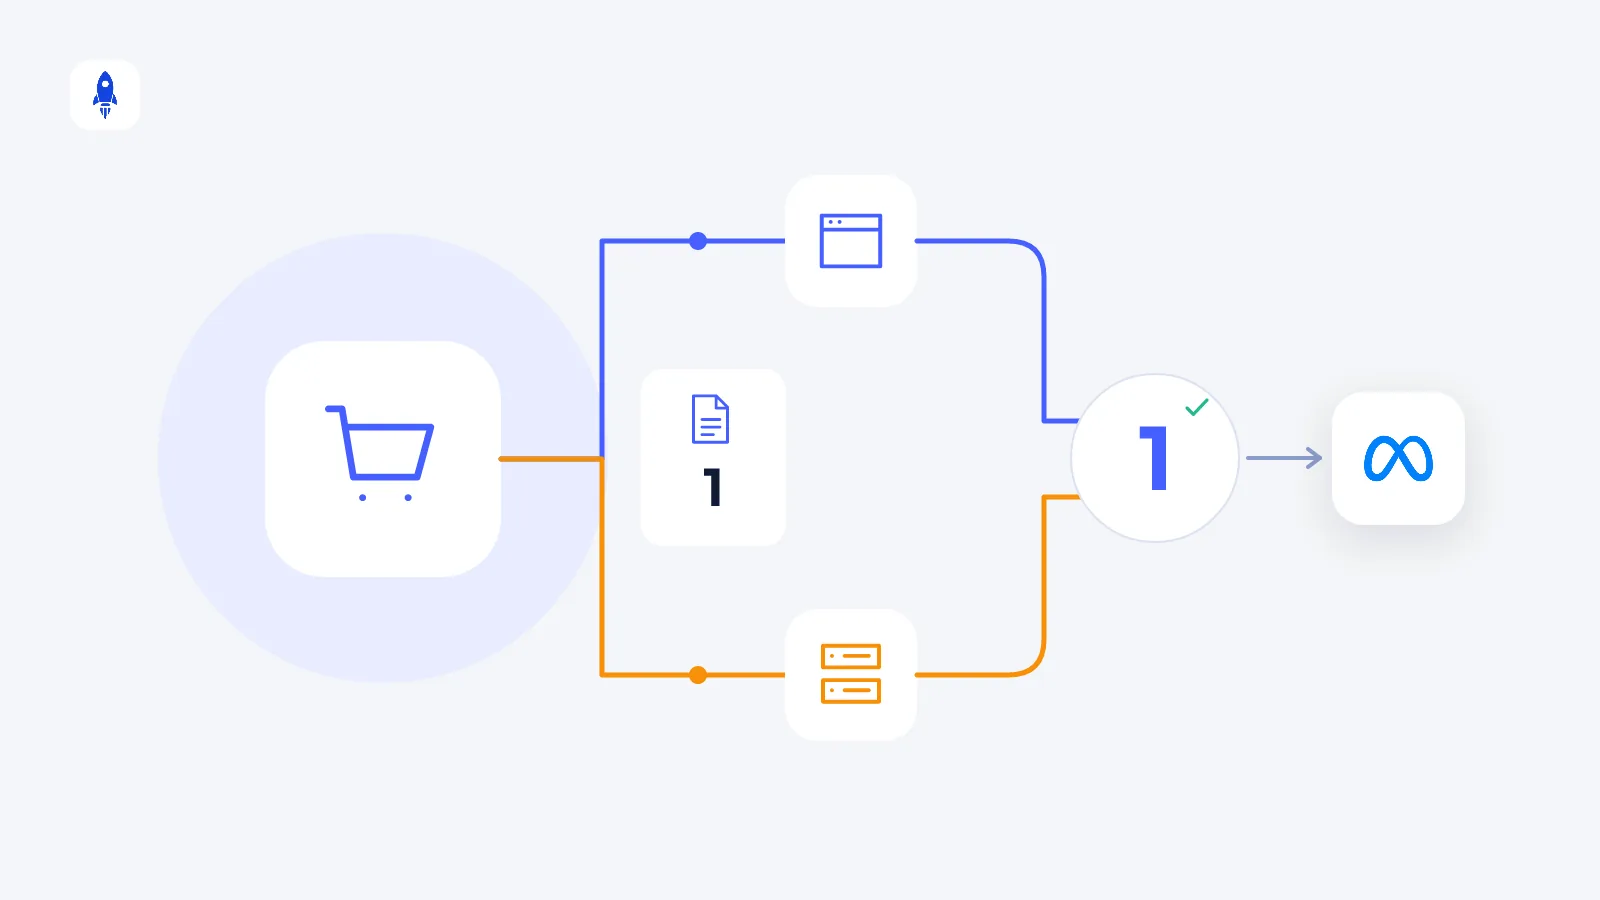
How the Conversions API captures sales the Meta Pixel misses, how double counting is prevented, Event Match Quality, and what to check when setting it up.
CiroFly is a reporting and management dashboard that brings ad, store and marketplace data into one place. What it does, who uses it and which channels it connects.
Automatic updates instead of manual exports and copy-paste — what it means for agency teams.
Awareness, traffic, sales… where is each budget going? Clarify it with the objective filter in the source picker.
Daily metric cards, trend charts and channel breakdowns instead of scattered spreadsheets and platform screens.
Account type, company name and adding client brands — the difference between an agency and a brand owner.
The brand owner follows their own performance; the agency presents from the same data source.
A single-brand PDF or a multi-brand package — output ready for client presentations.
All channels, sales channels, ad channels: where each metric comes from and when ROAS is meaningful.
Search dozens of brands, jump to reports and export in bulk.
Fresh enough for daily reporting — why not every second?
Meta, Google Ads, TikTok, e-commerce platforms and marketplaces — data sources combined in one dashboard.
Agency, client and admin roles — who can see your data?
Compare two brands over the same period — benchmarking within your portfolio.