
How to calculate ROAS in e-commerce — and what is a good ROAS?
· 8 min read

ROAS (return on ad spend) is the revenue driven by ads divided by what you spent on them: 10,000 in spend and 50,000 in revenue means a ROAS of 5. But a “good ROAS” isn't a fixed number — it depends on your product margin, VAT, shipping and return rate, so each brand has its own.
What exactly does ROAS measure?
ROAS (Return on Ad Spend) shows how much revenue each unit of currency spent on ads brings back. The formula is simple:
Say you spent 20,000 on Meta ads in a week and those ads drove 90,000 in sales. ROAS = 90,000 ÷ 20,000 = 4.5. Some teams write it as a percentage (450%); it means the same thing.
ROAS measures efficiency, not profitability. A ROAS of 4.5 sounds good, but if your gross margin is thin those sales may still lose money. That's why ROAS should be read together with margin.
How do you calculate break-even ROAS?
Break-even ROAS is the point where ads neither make nor lose money. In its simplest form:
If your average gross margin is 40%, break-even ROAS = 1 ÷ 0.40 = 2.5. Any ROAS below 2.5 means the ads aren't paying for themselves.
In practice, also factor in:
- VAT: Ad platforms and store dashboards often show revenue including VAT. Use the VAT-exclusive amount for profitability.
- Shipping and packaging: If you offer free shipping, the cost per order cuts straight into margin.
- Payment fees: The percentage your payment provider takes.
- Returns and cancellations: A 10% return rate means a tenth of reported revenue won't actually stay.
- Marketplace commission: If the sale happens on a marketplace, its commission comes out of margin.
Once you work with the contribution margin left after these, break-even ROAS usually turns out higher than you expected.
What is a good ROAS?
Rules of thumb like “a ROAS of 4 is good” are misleading. The right question is: how far above your own break-even ROAS are you?
- Below break-even: Ads aren't covering their cost. Unless it's a deliberate customer-acquisition play, review budget and targeting.
- Slightly above break-even: Ads are profitable but there's limited room to grow; creative and targeting improvements come first.
- Well above break-even: Consider scaling. Increase budget gradually and watch how ROAS responds.
Because margin structures differ, cosmetics, fashion, electronics and food brands have very different target ROAS levels. In low-margin categories like electronics, break-even can reach 6–8, while for high-margin products even around 2 can be profitable.
Why does platform ROAS differ from real ROAS?
The ROAS shown by Meta or Google uses sales attributed by that platform. Your store's total revenue covers every channel. They differ for several reasons:
- More than one ad platform can claim the same sale.
- Platforms record a conversion on the date of the ad interaction; your store records it on the order date.
- Returns and cancellations don't flow back to the ad platform.
- Marketplace sales (on Trendyol, Hepsiburada and the like) are usually invisible to ad pixels.
That's why many teams track two numbers: platform ROAS for campaign and creative decisions, and store-level (blended) ROAS for budget decisions. We cover the causes in detail in why ad platform and store numbers don't match.
What's the difference between ROAS, POAS and MER?
- ROAS: Revenue ÷ ad spend. Efficiency at campaign or channel level.
- POAS (Profit on Ad Spend): Gross profit ÷ ad spend. Shows profitability directly; above 1 means profitable.
- MER (Marketing Efficiency Ratio): Total revenue ÷ total marketing spend. Shows overall efficiency without splitting by channel.
Growing e-commerce brands usually use all three: ROAS for daily optimisation, POAS as a profitability check, MER for management reporting.
How can you improve ROAS?
- Push your most profitable products. Concentrate ads on high-margin best sellers.
- Refresh creatives regularly. The longer an ad runs, the lower its click-through rate and the higher its cost. Our article on creative fatigue covers the warning signs.
- Raise average order value. Bundles, free-shipping thresholds and complementary product suggestions bring more revenue for the same ad cost.
- Fix your measurement. Under-tracked conversions make ROAS look lower than it is; server-side measurement closes that gap.
- Improve conversion rate. Page speed, checkout steps and trust signals raise ROAS without changing spend.
How often should you review ROAS?
Daily ROAS is noisy; with small budgets, reacting to a single bad day is a mistake. A practical rhythm:
- Daily: Spend and anomaly checks (did a budget run out, was an ad rejected?).
- Weekly: ROAS decisions per campaign and creative.
- Monthly: Budget split across channels and target-ROAS updates.
Seeing ad, store and marketplace data over the same date range makes this rhythm much easier. Dashboards like CiroFly combine sales-channel revenue with ad-channel spend on one screen, so you don't have to do this maths by hand.
Frequently asked questions
What is the ROAS formula?+
ROAS = revenue from ads ÷ ad spend. If 5,000 in spend produced 25,000 in revenue, ROAS is 5.
Is a ROAS of 3 good?+
It depends on your brand. With a 40% gross margin, break-even ROAS is 2.5 so 3 is profitable; with a 25% margin, break-even is 4 and 3 loses money.
Should VAT be included when calculating ROAS?+
For profitability, VAT-exclusive revenue is more accurate. Platforms and store dashboards often show VAT-inclusive amounts, so make sure you compare on the same basis.
What is the difference between ROAS and ROI?+
ROAS only looks at how much revenue ad spend generated. ROI measures the profitability of the total investment, including product cost, operations and other expenses.
Why doesn't ROAS in the ad platform match my store?+
Platforms count sales by their own attribution rules: the same sale can be claimed by several platforms, returns aren't reflected and marketplace sales are often invisible. Track store-level ROAS for budget decisions too.
See your ad, store and marketplace data in one dashboard
CiroFly combines your sales and ad channels and updates ROAS, revenue and channel breakdowns automatically every day.
Related articles
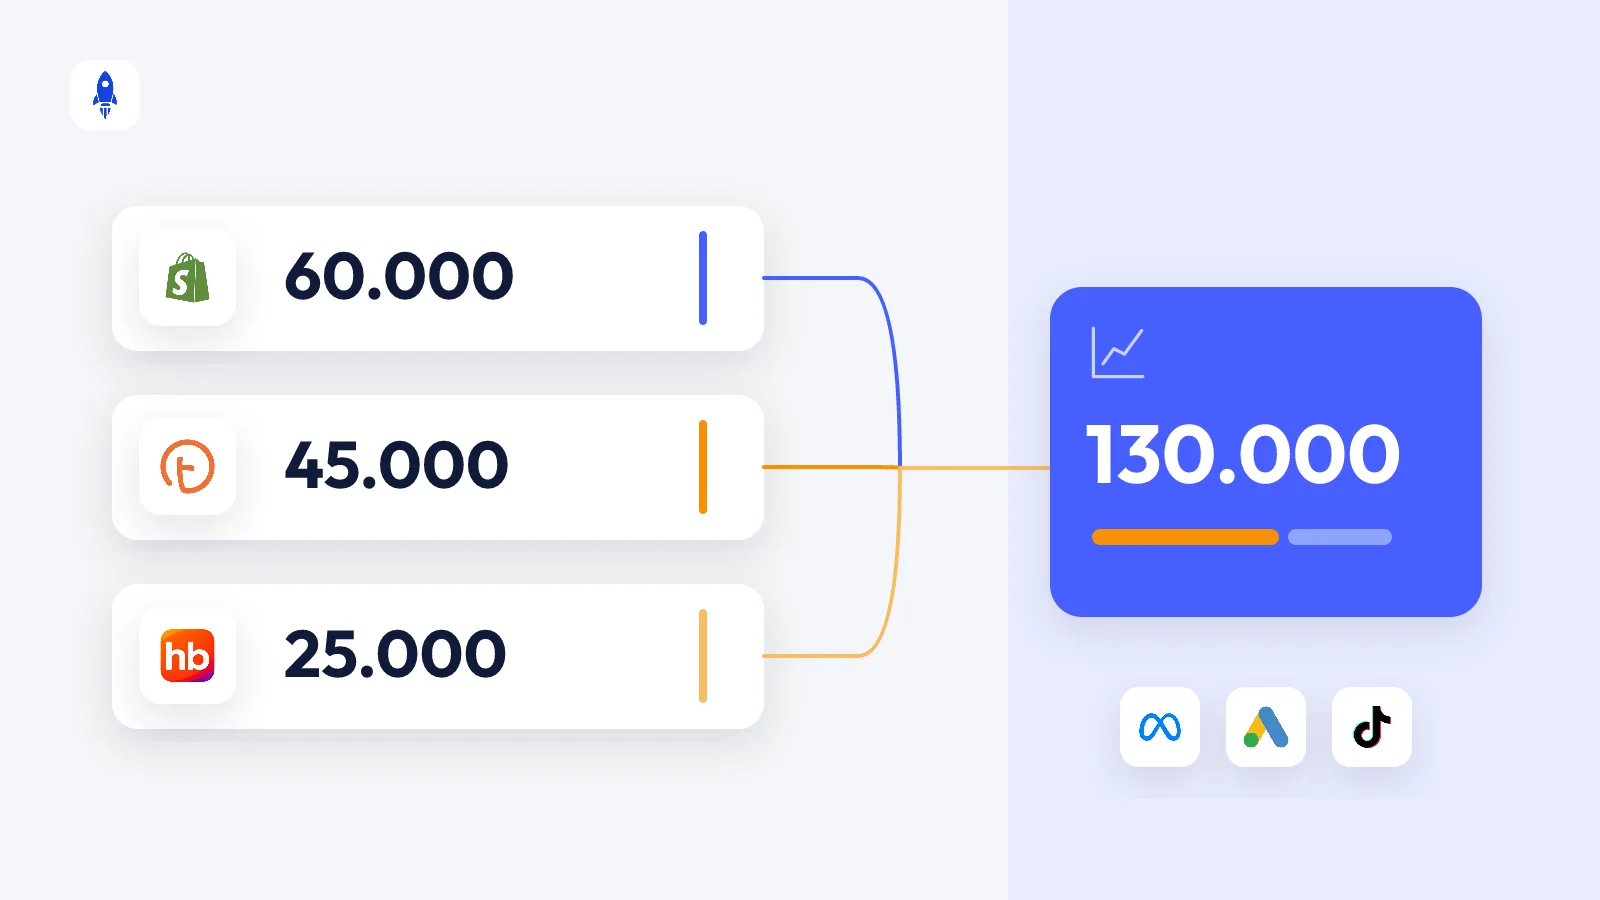
How to count marketplace sales in your ad performance
Measuring how Meta and Google ads affect sales on marketplaces like Trendyol, Hepsiburada and n11 — reading it correctly with blended ROAS, MER and channel share.
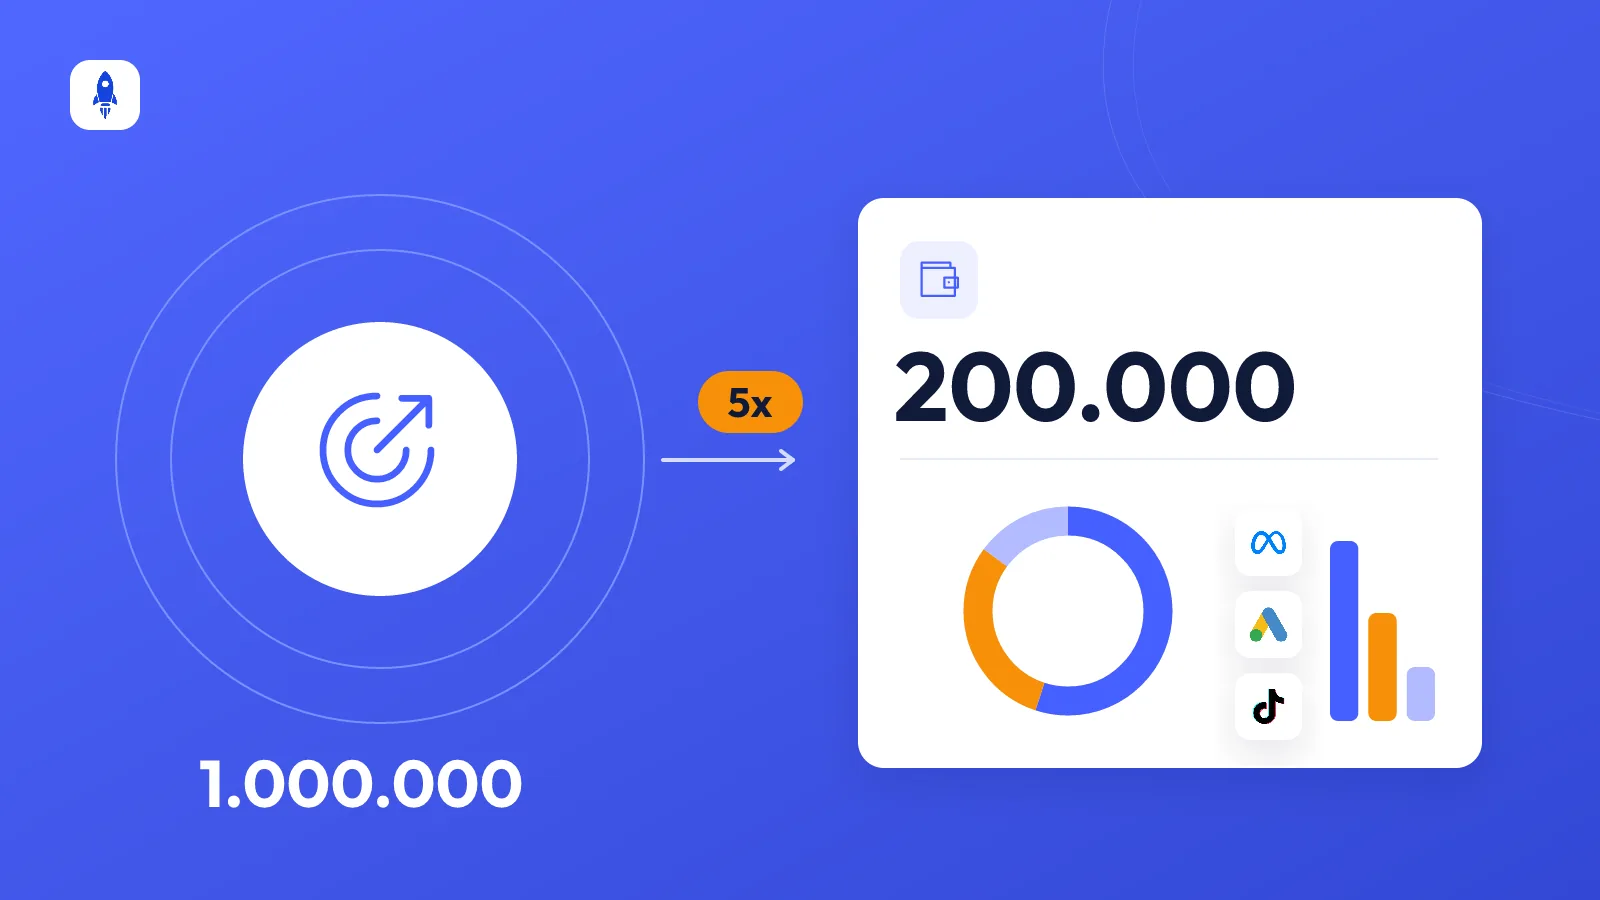
How to set an e-commerce ad budget — and split it across channels
A practical method to work out your ad budget backwards from a revenue target, split it between Meta and Google, and know when to scale up or cut back.
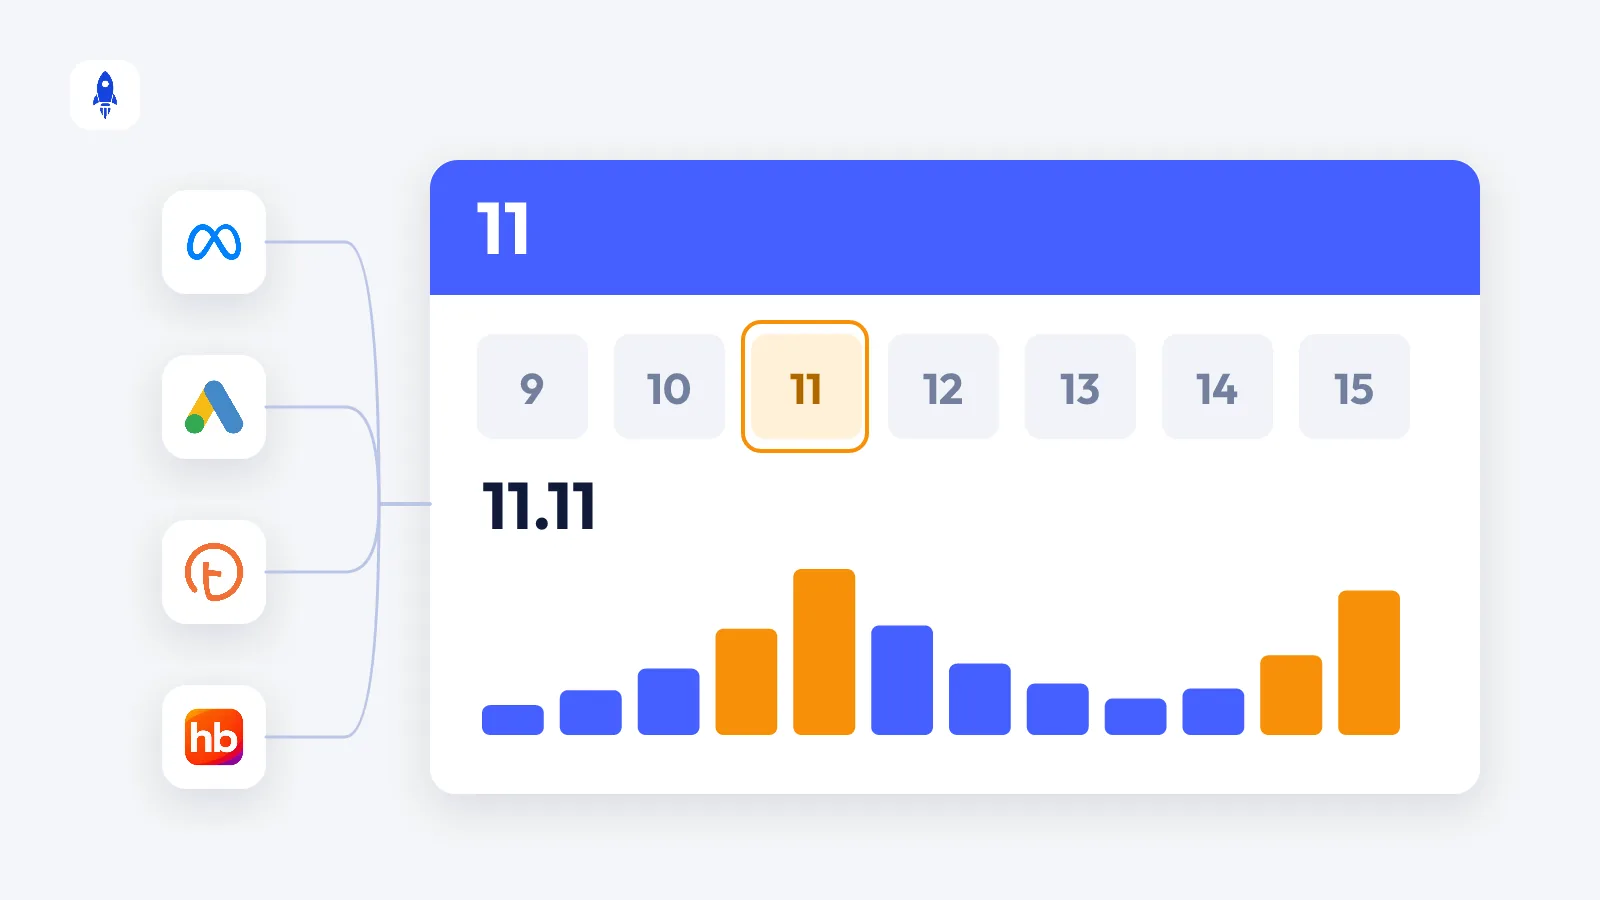
An ad plan for the November sales season: preparing for 11.11 and Black Friday
A November ad calendar for e-commerce brands: preparation, warm-up, campaign week and after — with budget, creative, stock and marketplace planning.